

One Sector Got Every Second Rupee. One Sector Was Quietly Sold
Saturday, 21 November 2026, Kolkata: In just 15 days, foreign investors put ₹84,291 crore into Indian equities. That is more than the ₹70,704 crore they had sold in the previous two months combined.

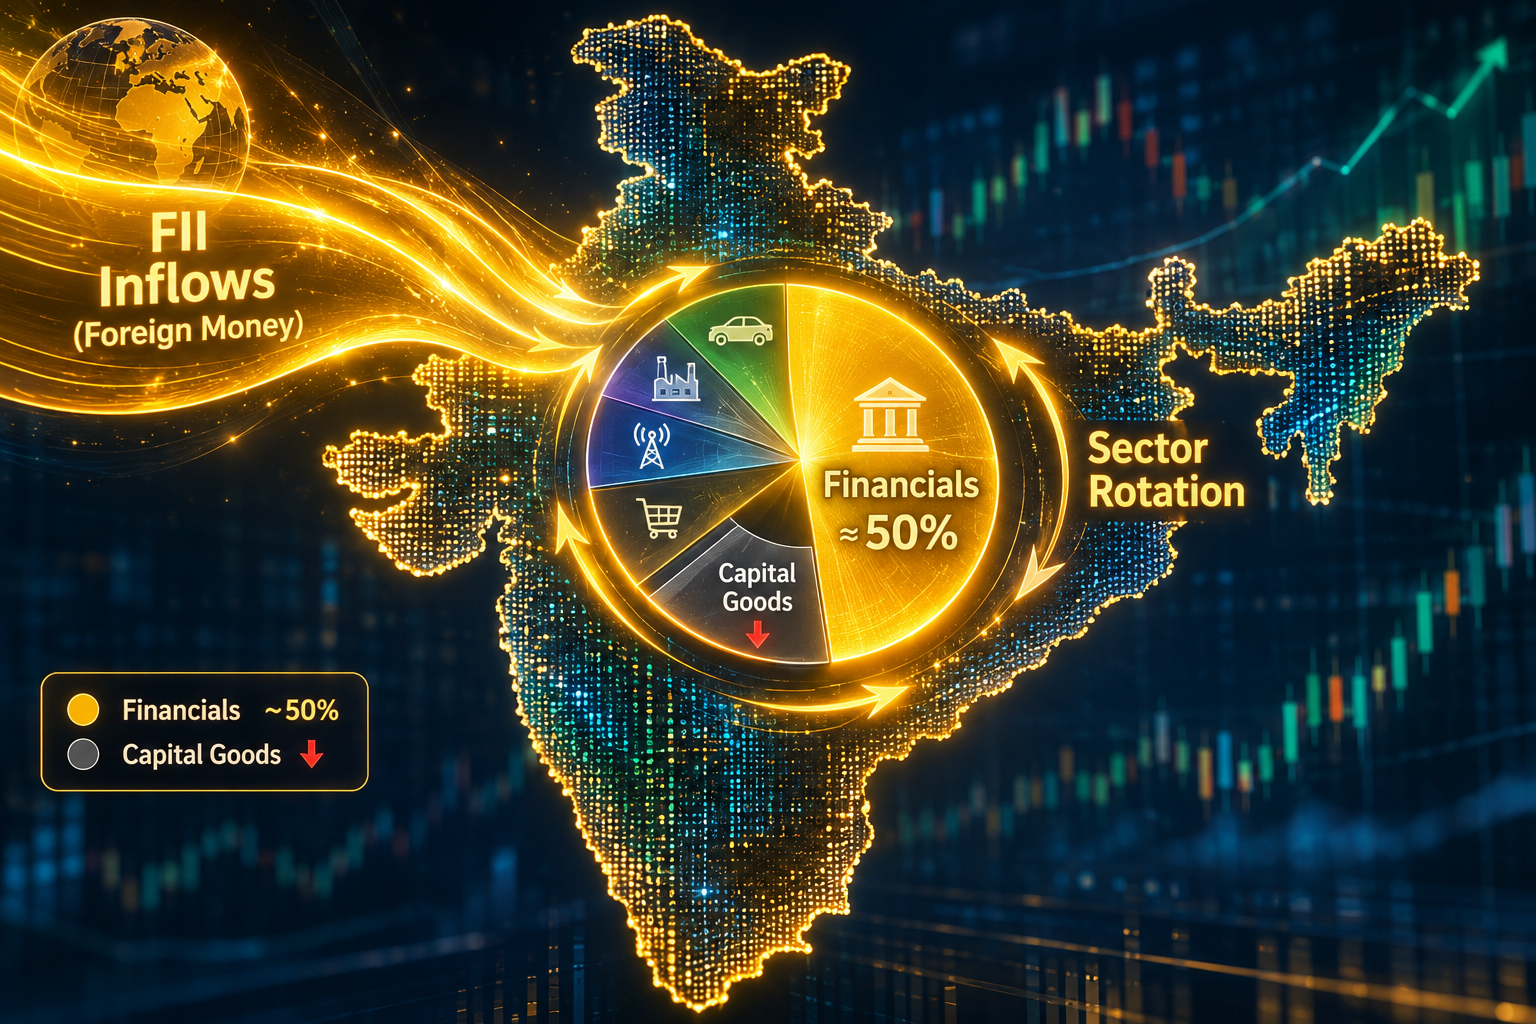
But look at where the money went. Financial services alone absorbed ₹43,102 crore, which is 51 of every 100 rupees.Five sectors took 83% of the inflow. And while 17 of 22 sectors received money, capital goods lost ₹3,781 crore, the worst of any sector in the two fortnights in the sheet.
If you only read the headline (“FIIs are back”), you will miss where the real opportunity and the real danger are. Stay tuned to unfold the real truth.
The Big Picture This Week
War and world markets: The US–Iran ceasefire from April remains fragile, with fresh Houthi attacks on Riyadh, tanker incidents near Hormuz and reports of possible new US strikes. Yet hopes of peace deals in Iran and Ukraine and a Democratic win in the US midterms have pushed global money out of AI-linked stocks and into markets like India.
Brent crude: Brent slipped to about $90–92 a barrel on 20 November, its third straight weekly fall and well below about $104 on 2 November, though still roughly 44% above a year ago. Hormuz shipments are back near pre-war levels.
Rupee: The rupee is trading around ₹92.7–93 to the dollar, its strongest since April, helped by record FII buying and cooling crude.
Indian economy: The RBI raised the repo rate by 25 bps to 5.5% with a “calibrated tightening” stance, projecting FY27 GDP growth of 7.1% and inflation of 5.2% (about 6% in Q3). The Q2 GDP print is due on 30 November, with economists expecting around 7.4–7.5%.
Imports and exports: October brought record merchandise exports of $49.47 billion (+45% year on year) but a merchandise deficit of $39.88 billion. The combined goods-and-services deficit was $20.09 billion, and the April–October deficit has widened to $93.35 billion.
Budget ahead: Union Budget 2027-28 is expected on 1 February 2027 with FY28 nominal GDP growth pegged at 10.5–11%. Markets are watching for any relief on capital gains tax for foreign investors, one reason FIIs are returning now.
1. Market Snapshot: The FII Turnaround
| Indicator | Latest Data |
|---|---|
| FII streak | 15 consecutive sessions of net buying, up to 20 Nov |
| FII net buying, week 16–20 Nov (NSE provisional) | ₹32,647 crore (previous week: ₹33,342 crore) |
| FII net buying, November so far (NSE provisional, 15 sessions) | ₹1,11,949 crore; DIIs net sellers at −₹61,787 crore |
| FPI equity inflow, 1–15 Nov (NSDL) | ₹84,291 crore, the largest 15-day buying on record |
| FPI flows in the prior two months | Net outflow of ₹70,704 crore |
| Calendar-2026 FPI flows (as of 10 Nov) | Net outflow of ₹2,41,406 crore, the worst year on record |
| FPI ownership, BSE 500 (Sept quarter) | 17.3%, a 10-year low |
| Market level | Nifty closed above 25,800 on 20 Nov, a nine-month high |
| Valuation (Jefferies, 10 Nov) | Nifty 100 at 18.6x forward EPS, about 5% below its 10-year average |
Why money is coming back: a rotation away from global AI-linked stocks, a sharp fall in crude, a stronger rupee, better earnings and financials that foreign funds had been under-owning.
Macro scorecard:
| Factor | Latest |
|---|---|
| Brent crude | About $90–92 on 20 Nov, third weekly fall, down from about $104 on 2 Nov |
| Rupee | About ₹92.7–93 per dollar, strongest since April |
| RBI | Repo rate raised 25 bps to 5.5%; FY27 GDP forecast 7.1%, inflation 5.2% |
| Trade (October) | Record merchandise exports $49.47 billion; merchandise deficit $39.88 billion; goods-and-services deficit $20.09 billion |
| Q2 GDP data | Due 30 November; economists expect about 7.4–7.5% |
| Union Budget | Expected 1 February 2027; FY28 nominal GDP growth pegged at 10.5–11% |
| Global | Rotation away from AI-linked stocks; US–Iran ceasefire fragile |
NSE (exchange cash market) and NSDL (depository) figures use different methods, so November totals differ. Do not mix them.
2. The Full NSDL Scoreboard: Where FPI Equity Money Went (₹ crore)
| Rank | Sector | Oct 16–31 | Nov 1–15 | Nov Flow as % of 31-Oct Equity AUC | Equity AUC Change (31 Oct to 15 Nov) | Verdict |
|---|---|---|---|---|---|---|
| 1 | Financial Services | −883 | +43,102 | 2.20% | +15.3% | Rotated in, strongly |
| 2 | Telecommunication | +11,065 | +7,570 | 2.03% | +7.9% | Continuing, cooling |
| 3 | Automobile & Auto Components | −1,098 | +7,551 | 1.59% | +11.6% | Rotated in |
| 4 | Consumer Services | −662 | +6,519 | 2.25% | +9.1% | Rotated in |
| 5 | Information Technology | +10,915 | +5,080 | 1.18% | −1.2% | Cooling, price weak |
| 6 | FMCG | −1,559 | +3,042 | 1.19% | +9.0% | Rotated in |
| 7 | Construction | −516 | +2,929 | 2.52% | +10.1% | Rotated in |
| 8 | Services | +658 | +2,633 | 1.41% | +9.3% | Steady inflow |
| 9 | Oil, Gas & Consumable Fuels | −970 | +2,036 | 0.50% | +12.3% | Turned positive |
| 10 | Consumer Durables | −402 | +1,091 | 0.63% | +11.4% | Turned positive |
| 11 | Construction Materials | −196 | +1,041 | 1.10% | +7.9% | Turned positive |
| 12 | Healthcare | −57 | +998 | 0.19% | +5.6% | Weak conviction |
| 13 | Power | −765 | +705 | 0.30% | +3.1% | Turned, thin |
| 14 | Realty | −438 | +649 | 0.59% | +14.1% | Turned positive |
| 15 | Media, Entertainment & Publication | +140 | +612 | 5.36% | +15.1% | Small base |
| 16 | Metals & Mining | −904 | +267 | 0.10% | +7.2% | Stabilising |
| 17 | Utilities | −27 | +15 | 0.59% | +11.6% | Negligible |
| 18 | Diversified | −16 | −8 | −0.25% | +9.7% | Minor outflow |
| 19 | Forest Materials | −58 | −10 | −0.94% | −0.7% | Minor outflow |
| 20 | Textiles | −21 | −98 | −0.48% | +1.2% | Outflow |
| 21 | Chemicals | −862 | −370 | −0.33% | +6.0% | Still out, selling easing |
| 22 | Capital Goods | −825 | −3,781 | −0.84% | +4.6% | Rotating out, worst |
| Total equity | +13,112 | +84,291 | 1.29% | +9.9% |
AUC = assets under custody. Change in AUC includes market price moves, not only FPI buying, so use it as a price-strength signal, not a flow measure.
Other segments, Nov 1–15 (₹ crore): Debt–General limit +1,167; Debt–VRR −702; Debt–FAR (government securities under the fully accessible route) +7,815, a sharp reversal from −6,235 in the second half of October; Hybrid −114; mutual-fund routes +124; AIF −9. All segments: +92,568.
3. Expert Analysis: What the Data Says About Sector Rotation

3.1 Phase one (16–31 Oct): the “safe tech and telecom” trade
Only IT (+₹10,915 crore) and telecom (+₹11,065 crore) drew serious money. Together they were ₹21,980 crore, or 168% of the ₹13,112 crore equity total, which means everything else was net sold. Eighteen of 22 sectors had outflows. This looks like cautious, selective re-entry into large, liquid, global-linked names.
3.2 Phase two (1–15 Nov): the broad “India domestic” rotation
The pattern flips. Financials, autos, consumer services, FMCG, construction and consumer durables all went from outflow to inflow within one fortnight. The money moved from global-linked sectors toward domestic-growth and under-ownedsectors. Financials alone took 51% of the inflow, and the top five sectors (financials, telecom, autos, consumer services, IT) took 83%.
3.3 Who is beaten down and why it matters
- Capital goods (−₹3,781 crore) is the clearest rotation-out. The outflow more than quadrupled in a fortnight, even as the sector’s assets rose 4.6% on market moves. That suggests selling into strength, a classic profit-taking pattern after a strong run in power-equipment and engineering names. This is our interpretation; NSDL does not give reasons.
- Chemicals (−₹370 crore) has now seen outflows for two straight fortnights (−₹1,232 crore cumulative), though the pace of selling has eased.
- Textiles, forest materials, diversified had small outflows and are marginal for index flows.
- Metals & mining (+₹267 crore) and healthcare (+₹998 crore) are technically inflows but are the weakest-conviction inflows, at 0.10% and 0.19% of their equity assets. Metals was sold in the last fortnight of October (−₹904 crore).
3.4 IT: the sector with money but no price
IT drew ₹15,995 crore over two fortnights, yet its assets under custody fell 1.2% while the market rose 9.9%. FPI buying has not yet been matched by price strength, which fits the “under-owned, contrarian” reading in Watchlist 2. The halving of inflow from ₹10,915 crore to ₹5,080 crore is a warning that the pace is slowing.
3.5 The price effect dwarfs the flow
Equity assets under FPI custody rose ₹6,42,864 crore in the fortnight (+9.9%), while net buying was ₹84,291 crore (1.3% of assets). Most of the gain came from prices. Financials alone gained about ₹3 lakh crore in custody value, of which roughly ₹2.57 lakh crore was price gain rather than new money. So “FPI inflow” and “sector rally” are connected, but the rally is much bigger than the cash that came in.
3.6 Debt flows tell a risk-appetite story too
The swing in the government-securities route (−₹6,235 crore to +₹7,815 crore) shows foreign money returning to Indian bonds as the rupee strengthened and crude fell. This supports the equity story but also raises the risk that flows reverse quickly if rates or oil turn.
4. Stock Watchlist 1: 20 Stocks With FII Momentum (Sector Flow Cross-Checked)
Sector flow is the NSDL equity figure for 1–15 Nov 2026 (₹ crore).
| # | Stock | NSDL Sector | FII/FPI Evidence | Sector Flow |
|---|---|---|---|---|
| 1 | BHEL | Capital goods | FPI stake up four straight quarters to 9.94% | −3,781 (caution) |
| 2 | ONGC | Oil, gas & fuels | Stake 8.55%, four quarters up | +2,036 |
| 3 | SAIL | Metals & mining | Stake 7.3%, four quarters up | +267 |
| 4 | Indian Bank | Financial services | Stake 6.87%, four quarters up | +43,102 |
| 5 | Bank of Maharashtra | Financial services | Stake 6.5% (2.35% a year ago) | +43,102 |
| 6 | LIC | Financial services | Stake 1.55% (0.13% a year ago) | +43,102 |
| 7 | Indian Overseas Bank | Financial services | Stake 0.48%, very low base | +43,102 |
| 8 | Eternal | Consumer services | FII holding 33.01% (from 29.09%) | +6,519 |
| 9 | Adani Enterprises | Services | FII holding 10.66% (from 8.77%) | +2,633 |
| 10 | Adani Ports | Services | FII holding 15.95% (from 15.58%) | +2,633 |
| 11 | Trent | Consumer services | FII holding 15.28% (marginal rise) | +6,519 |
| 12 | Tech Mahindra | Information technology | FII holding 20.76% (from 18.66%) | +5,080 |
| 13 | ICICI Bank | Financial services | FII holding 34.68% (from 33.79%) | +43,102 |
| 14 | Apollo Hospitals | Healthcare | FII holding 43.19% (from 41.49%) | +998 |
| 15 | Cipla | Healthcare | FII holding 20.24% (marginal rise) | +998 |
| 16 | Titan | Consumer durables | FII holding 16.37% (from 15.39%) | +1,091 |
| 17 | JSW Steel | Metals & mining | FII holding 26.22% (marginal rise) | +267 |
| 18 | Larsen & Toubro | Construction | FII holding 19.22% (marginal rise) | +2,929 |
| 19 | HDFC Bank | Financial services | Led Nifty gains on 20 Nov; flow-based pick | +43,102 |
| 20 | Maruti Suzuki | Automobile | Up about 9% in the week of 16–20 Nov; flow-based pick | +7,551 |
Analysis: Ten of 20 stocks sit in four of the five best-funded sectors (financials, consumer services, IT and autos). The strongest combination of stake data and sector inflow is in Eternal, Tech Mahindra, ICICI Bank and the PSU banks. BHEL is the one name with a sector headwind: its stake rose through September, but capital goods saw heavy FPI selling in early November. Check its next shareholding filing before treating it as momentum. SAIL, JSW Steel, Apollo and Cipla sit in low-conviction sectors, so their FII support is thinner.
More expert notes:
- Two kinds of momentum. The PSU names (1–7) show a slow, multi-quarter build-up that began before November. The Nifty 50 names (8–18) show buying in the September quarter itself.
- Real conviction sits in the big stake jumps. Eternal (+3.9 percentage points), Tech Mahindra (+2.1), Adani Enterprises (+1.9), Apollo Hospitals (+1.7) and Titan (+1.0) show real additions. Cipla, JSW Steel, L&T and Trent rose by well under 0.3 points, so their FII support is thin.
- Price has already moved. Several of these stocks are up 30–50% this fiscal year, so entry price matters more here than in Watchlist 2.
Basis: stocks 1–7 come from the Business Today/AceEquity screen of large caps (market cap above ₹50,000 crore) with FPI stakes rising four quarters in a row to September 2026. Stocks 8–18 come from ACE Equity data on Nifty 50 companies where FII holdings rose between the June and September 2026 quarters. Stocks 19–20 are flow-based and should be verified against December-quarter filings.
5. Stock Watchlist 2: 20 Beaten-Down Stocks That Could Gain FII Momentum Next
| # | Stock | NSDL Sector | What FIIs Did Earlier | Sector Flow | Evidence |
|---|---|---|---|---|---|
| 1 | Max Healthcare | Healthcare | FII stake down about 10 pp over three quarters of 2026 | +998 | High |
| 2 | Kotak Mahindra Bank | Financial services | Stake down about 4.7 pp | +43,102 | High |
| 3 | Axis Bank | Financial services | Stake down about 2.7 pp to 43% | +43,102 | High |
| 4 | HDFC Life Insurance | Financial services | Stake down about 5.5 pp | +43,102 | Medium |
| 5 | InterGlobe Aviation (IndiGo) | Services | Stake down about 5.1 pp | +2,633 | Medium |
| 6 | Reliance Industries | Oil, gas & fuels | FII weight in foreign portfolios 9.1% to 5.3% since 2022 | +2,036 | High |
| 7 | Infosys | Information technology | FII weight 5.8% to 2.1% since 2022 | +5,080 | Medium |
| 8 | TCS | Information technology | FII weight 4.2% to 1.3% since 2022 | +5,080 | Medium |
| 9 | HCL Technologies | Information technology | IT majors’ foreign ownership 12.4% to 4.7% since 2022 | +5,080 | Medium |
| 10 | Asian Paints | Consumer durables | FII stake down over 20% in relative terms | +1,091 | Medium |
| 11 | Dr. Reddy’s Laboratories | Healthcare | FII stake down over 20% in relative terms | +998 | Medium |
| 12 | JSW Energy | Power | Jefferies pick (no stake history found) | +705 | Low |
| 13 | UltraTech Cement | Construction materials | Jefferies pick | +1,041 | Low |
| 14 | Varun Beverages | FMCG | Jefferies pick | +3,042 | Low |
| 15 | Indian Hotels Company | Consumer services | Jefferies pick | +6,519 | Low |
| 16 | DLF | Realty | Jefferies pick | +649 | Low |
| 17 | Sona BLW Precision Forgings | Automobile | Jefferies pick | +7,551 | Low |
| 18 | Bajaj Finance | Financial services | FIIs hold about 21% vs DII 13% | +43,102 | Low |
| 19 | Bharti Airtel | Telecommunication | FIIs hold about 28% vs DII 19% | +7,570 | Low |
| 20 | Wipro | Information technology | FIIs hold about 11% vs DII 7% | +5,080 | Low |
Analysis: All 20 stocks sit in sectors that received FPI money in early November, which is the good news for this list. The best-aligned names are those where heavy past selling meets a strongly funded sector: Kotak, Axis, HDFC Life, Reliance and the IT majors. Be careful with Max Healthcare: healthcare drew only 0.19% of its assets in new money, and the stock has already jumped about 14% this week, so some of the move is done. “Undervalued” here means de-rated and under-owned by FIIs, not a P/E screen; we did not find reliable per-stock valuation multiples in the sources, so check P/E and P/B yourself.
More expert notes:
- IT is the contrarian bet. Foreign ownership in the big four IT names fell from 12.4% to 4.7% since 2022. The sector drew ₹5,080 crore in early November yet its custody value fell 1.2%, so the “under-owned” story has no price confirmation yet.
- Heavy FII selling is not the same as cheap. A falling stake can mean weak earnings, not just a valuation reset. HDFC Bank’s price fell about 26% in the March quarter as FII holding dropped from 47.7% to 44.1%, reflecting concern about growth after the merger as much as valuation.
- Domestic funds already own more. In Max Healthcare, DII ownership rose by 12.5 points as FIIs sold about 13. That can limit further FII selling but also means fewer sellers for new FII buyers to take stock from.
- Low-evidence entries (12–20) rest on one Jefferies note or sector flows. Validate them before acting.
Basis: names 12–17 are included only because Jefferies listed them as plays on an FPI reversal; we found no stake history for them. Names 18–20 are filler with sector-flow evidence only and are the lowest-confidence entries.
6. Risks and Data Limits
| Item | Why It Matters |
|---|---|
| Concentration | Over half of the inflow went to one sector. A reversal in financials would hit both watchlists |
| Fortnightly data | NSDL data is published every two weeks; the 16–30 November figures will show whether capital goods selling continues |
| Prices vs flows | Most of the rise in FPI assets was price gains, not new cash |
| Classification | NSDL sector labels differ from index or company descriptions. Stock-to-sector mapping here is our best match |
| Shareholding data lags | Stock-level FII stakes are from the September quarter; November buying appears only in the December-quarter filings |
| Interpretation | NSDL shows what moved, not why. Reasons given here are our analysis, not NSDL statements |
| Event risk | Iran/Hormuz headlines, rate path, crude oil and the Budget can all change the flow quickly |
7. The Takeaway: How to Read This as an Investor
- Follow the sector, then the stock. Money moved by sector first. Stocks in strongly funded sectors (financials, telecom, autos, consumer services, construction) have the better tailwind.
- Treat capital goods as a caution flag until FPI selling stops. BHEL is the name to double-check.
- IT is the contrarian test. Money came in but prices lagged. If the next NSDL print shows inflows holding while prices recover, the case strengthens. If inflows fade below ₹5,000 crore, it weakens.
- Watch the next NSDL fortnight (16–30 November). If financials’ share of inflow falls and the money spreads to healthcare, metals and power, the rotation is broadening. If financials stay above 50%, the trade is narrow and fragile.
Disclaimer: This report is for information only and is not investment advice or a recommendation to buy or sell any security. Consult a SEBI-registered advisor before investing. Sector data: NSDL FPI sector-wise investment, 1–15 November 2026. Other sources: NSE, Jefferies, ACE Equity/Business Today, Business Standard, Kotak Neo, HDFC Sky.
About The Author
Discover more from Jist Feed
Subscribe to get the latest posts sent to your email.